|
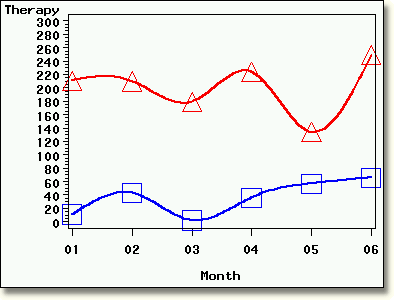
Introduction SAS/GRAPH software enables you to display your data graphically. To create a variety of plots, you can use the GPLOT procedure within SAS/GRAPH software. This lesson shows you how to create single plots and overlaid plots,
as well as how to refine the plots by specifying plotting symbols, tick-mark
values for the axes, and methods of interpolating plotted points. You
also learn different ways of viewing and storing graphs.
|

|
1 hour |
|
In this lesson, you learn to
|
|
complete the following lessons:
|