Introduction
If you work with data, chances are good that you also need to create
reports based on your data. For example, suppose that you run a specialty
foods shop and need to prepare some reports for regular board meetings.
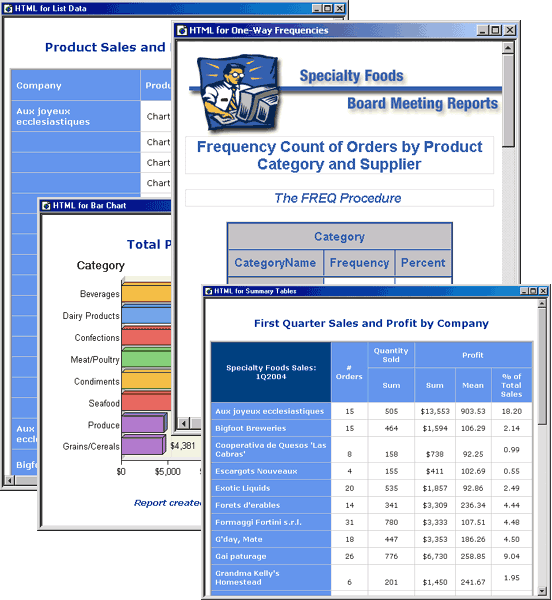
You need to create reports such as the following:
- a list report that groups the data by supplier
and displays totals for each supplier and for all products
- a frequency report that shows the number of orders
for each product category and supplier, and the percentage of total
orders that each product category and supplier represents
- a summary table that shows the number of orders
and the number of products that have been sold, the total and average
profit for orders, and the percentage of total sales
- a bar chart that shows total profit by product
category.
|

